Volume Analysis: The Truth Serum of the Futures Market
How Volume Analysis Reveals the True Intent of the Market

Most aspiring traders spend their careers obsessing over price. They memorize candlestick patterns, draw intricate geometric lines, and clutter their charts with lagging indicators that only tell them what has already happened. While price represents the advertisement of value, it is often misleading. To understand the true intent of the market, one must look at the participation behind the move. This is where volume analysis comes in.
Volume is the fuel that drives the market engine. In the high-stakes world of futures trading, volume is not just a secondary indicator; it is the only non-lagging data point available aside from price itself. It validates trends, reveals weakness, and exposes the footprints of institutional players who cannot hide their size. Understanding volume is the difference between guessing which way the wind is blowing and seeing the storm before it hits.
The Relationship Between Effort and Result
The core philosophy of volume analysis rests on the relationship between effort and result. In this context, volume represents the effort put into a move, while price change represents the result. A healthy market moves in harmony, where significant price progression is supported by significant volume. This confirms that participants are willing to transact at higher or lower prices and that the trend has conviction.
However, the most profitable opportunities often arise when this relationship diverges. If you witness a market pushing aggressively into a new high with diminishing volume, you are seeing a divergence. The effort is decreasing while the result is still occurring, which is a classic sign of exhaustion. The buyers are running out of ammunition, and the smart money is no longer participating. This anomaly is often the first warning sign of a reversal, allowing the astute trader to exit a position or prepare for a counter-trend trade long before the price chart shows a bearish candle.
Beyond the Histogram: Volume Profile and Delta
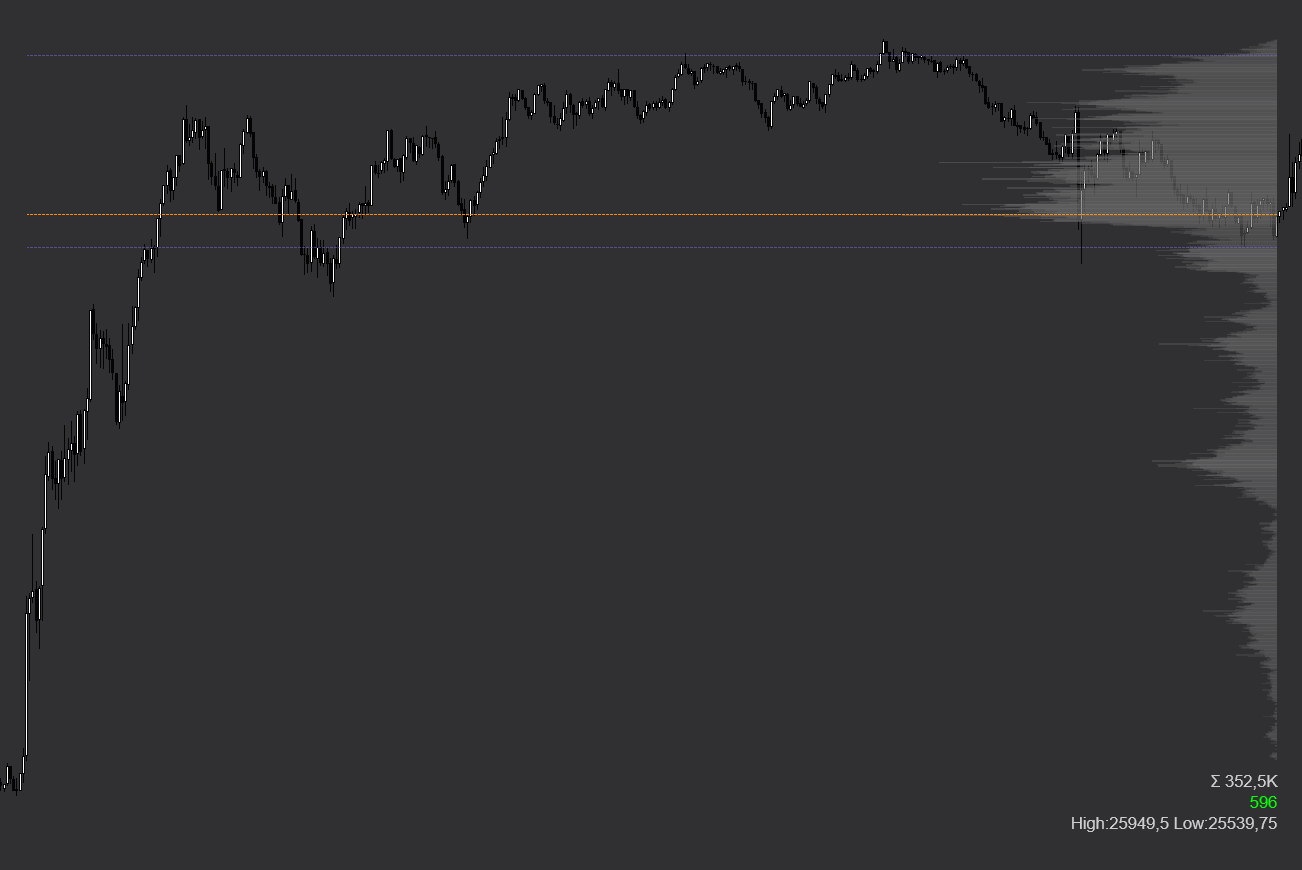
While the standard volume bars at the bottom of a chart provide a temporal view of participation, professional futures traders often require a more dimensional perspective. This leads to the utilization of Volume Profile and Delta. Unlike standard volume, which answers "when" a trade occurred, Volume Profile answers "where" the volume occurred. It plots trading activity on the vertical axis, creating a map of historical value.
This map reveals the Point of Control, which is the price level with the highest traded volume, acting as a powerful magnet for price. It also highlights low-volume nodes, which are areas where price moved too quickly for fair trade to occur. These vacuums often get revisited and filled. By understanding these structural elements, a trader stops seeing support and resistance as arbitrary lines and starts seeing them as zones of acceptance or rejection based on actual capital commitment.
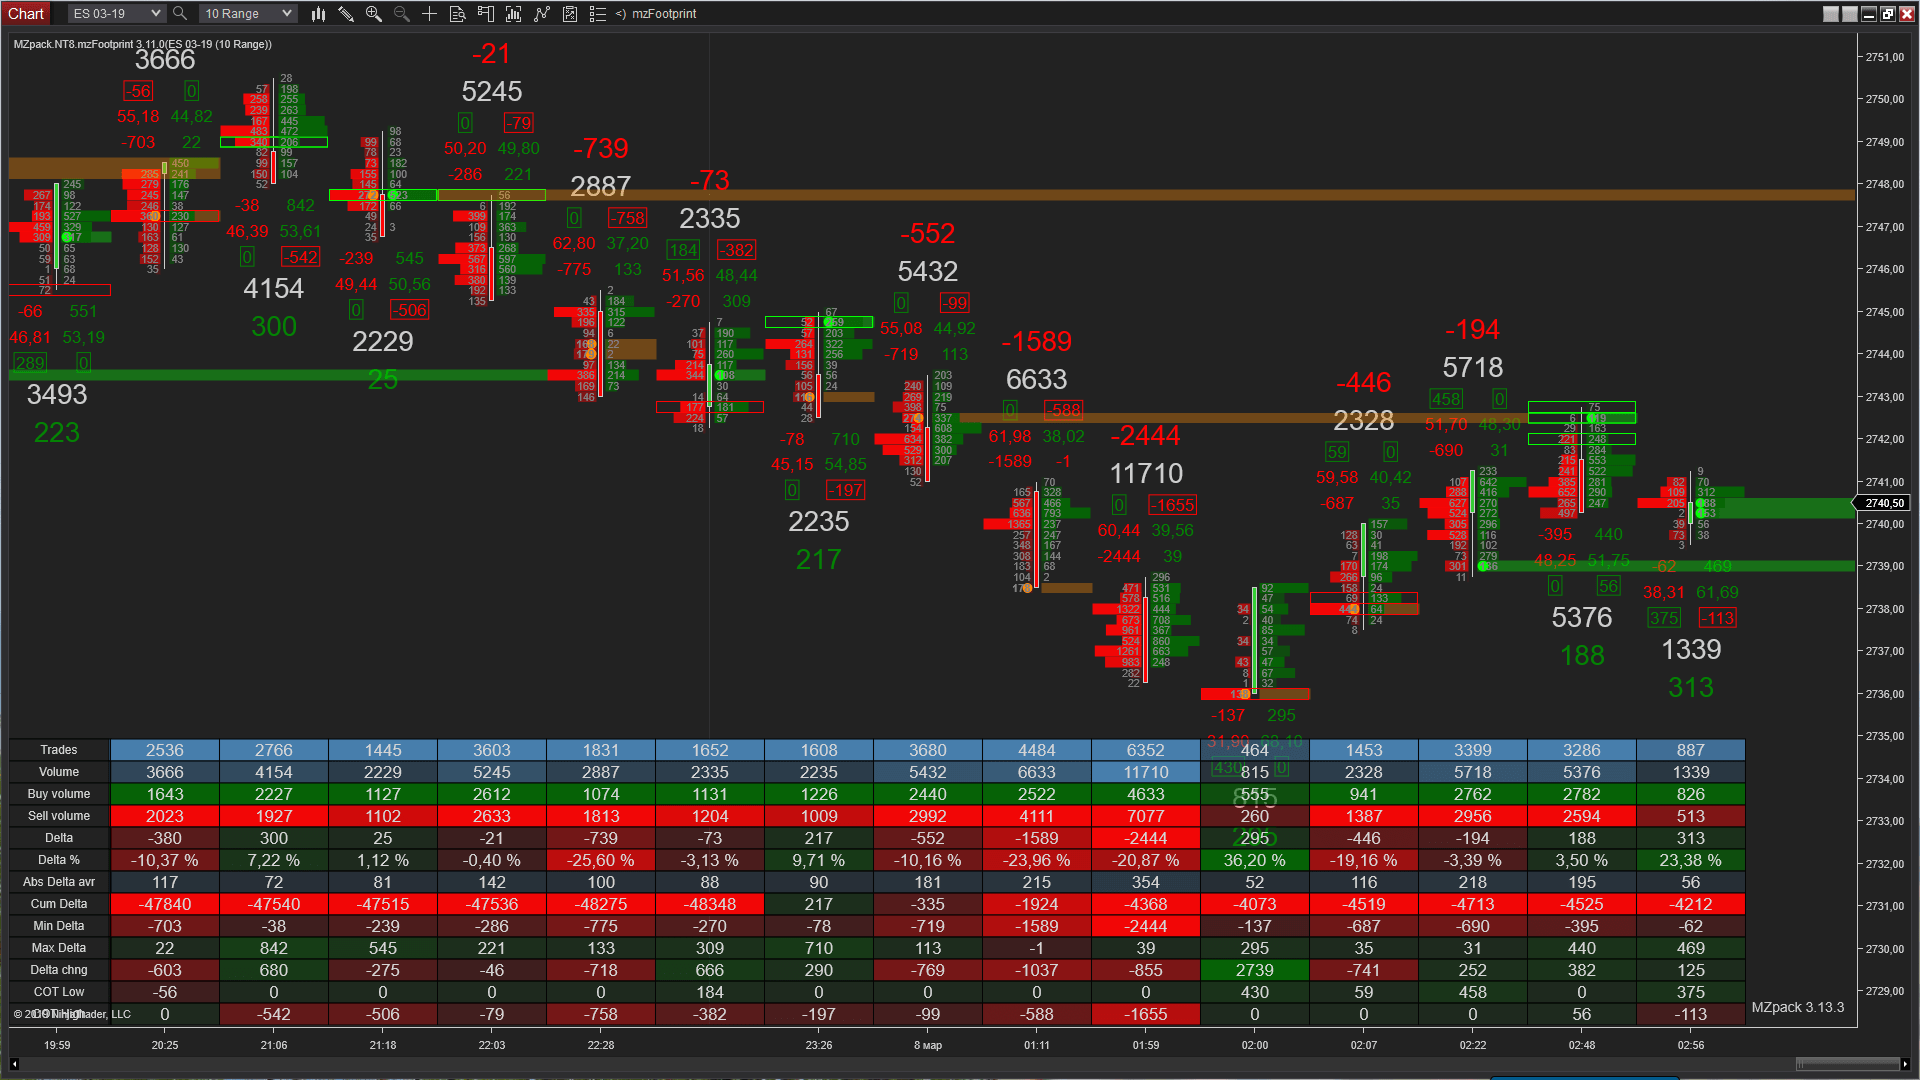
Tracking the Institutional Footprint
The futures market is a zero-sum game dominated by large institutions. Retail traders cannot move the S&P 500 or Crude Oil markets on their own; only institutional liquidity can sustain a trend. Volume analysis is effectively the art of tracking these elephants. A retail trader might hide their intentions with a limit order, but an institution needing to unload thousands of contracts cannot hide the resulting volume spike.
When a support level holds despite a massive spike in selling volume, it indicates that a large passive buyer is absorbing the selling pressure. This is institutional accumulation. Conversely, when a breakout occurs on low volume, it suggests that the institutions are absent and the move is likely a "retail trap" engineered to trigger stop-losses. By aligning your execution with the presence or absence of institutional volume, you stop providing liquidity to the pros and start trading alongside them.
Why Volume is Critical for Your Evaluation
At Sirok Futures, we emphasize that consistency is the primary metric of success. Volatile, low-volume environments are often the graveyard of evaluation accounts. During these periods, price action becomes erratic and "choppy" because there is no dominant liquidity provider to smooth out the auction. A trader relying solely on price patterns will be whipped out of positions repeatedly during these low-participation environments.
Incorporating volume analysis into your routine acts as a filter. It gives you the discipline to stay on the sidelines when participation is low and the conviction to strike when the market is energized. Passing a futures evaluation is not about catching every single tick; it is about identifying the high-probability setups where the market has revealed its hand. Volume is the mechanism that reveals that hand. When you are ready to trade with the clarity that comes from understanding market participation, our evaluation program is here to provide the platform you need to succeed.
Subscribe to our weekly newsletter
Stay informed, master the markets, and achieve your goals.